Best time to see the northern lights: why September and March beat December
December and January are the quietest months for storms. March, April, September and October have twice as many: activity by month, usable night hours and the Moon.

The best time to see the northern lights is usually given as “late August to April”, or “September to March”. That is right, and it tells you almost nothing: between those dates, the months are far from equal. Some guides call February prime time. Others list September, October, March and April.
This page measures the gap. It rests on thirty years of the Kp index, works out the hours of usable night place by place, gives you the Moon for the 2026-27 season and places this year in the solar cycle. The result contradicts two things you will read almost everywhere: December is not the best month, and 2024 did not close the door.
December and January, the months everyone books for polar night, are the quietest of the year
An aurora comes from a stream of solar wind particles, and the Kp index measures how hard Earth is shaken by it. So you can count, month by month, the days when activity reaches storm level: at least one three-hour reading at Kp 5 or higher, which is level G1 on NOAA’s scale. It is also, roughly, what New York needs for a glow on the northern horizon (Kp 5.0).
September comes first with 14% of days, followed by October, March and April. December closes the ranking at 4.7%, with January just ahead at 6.2%. A September day is three times as likely to be a storm day as a December day.
Thirty years, ninety years: the same ranking
Thirty years is short, and you might suspect a fluke of the last cycle. The same calculation over 1932-2026, then over the last two cycles alone, gives the same result: the same four months lead in all three cases, and December and January are always the two least active.
| Period | March, April, September, October | December, January | Gap |
|---|---|---|---|
| 1932-2026 | 20.8% | 10.8% | ×1.9 |
| 1996-2025 | 12.5% | 5.5% | ×2.3 |
| 2009-2025 | 10.0% | 3.5% | ×2.9 |
Percentages vary from one period to the next because activity follows the solar cycle. The ranking of the months does not move.
The lower the threshold, the smaller the gap
Storm level is not what every viewer needs. Northern Minnesota needs only Kp 1.6 for a glow, Duluth 2.3. So it is worth knowing that the same four months still lead when you count days at Kp 4 or higher, but the gap narrows: 29% of days in those months against 20% in December and January, a factor of 1.5. At Kp 3 or higher it is 56% against 46%, a factor of 1.2.
In plain terms: the seasons matter most for the big storms, the ones that carry the aurora far from the pole. For a modest storm, the month shifts your odds by a fifth to a half, which a cloudy night or a full Moon can easily cancel.
Why the equinoxes
The effect carries the names of Russell and McPherron, who described it in 1973. Twice a year, around the equinoxes, Earth’s magnetic axis is oriented in such a way that the solar wind’s magnetic field connects more easily to Earth’s own, and that connection is what injects the energy of storms. Around the solstices the geometry is less favorable.
Under the oval, it is not the aurora that changes, it is its strength
The statistic does not mean the same thing depending on where you stand. Under the oval, in Tromsø or Fairbanks, the aurora is there at Kp 0: according to NOAA, between roughly 60 and 75 degrees of latitude you can see it more than half the nights of the year. A storm does not create it, it stretches it, pushes it south and makes it brighter. From the lower 48, the UK or Europe, it is everything: without a storm, there is nothing to see.
Norya’s editor went to Tromsø once, in February, and remembers it as magical. February is nonetheless below the yearly average for storms (7.9% of days, against 9.8% over the year). That is not a contradiction, it is the demonstration: at that latitude the statistics tell you how many storms to hope for, not whether the trip will be a success.
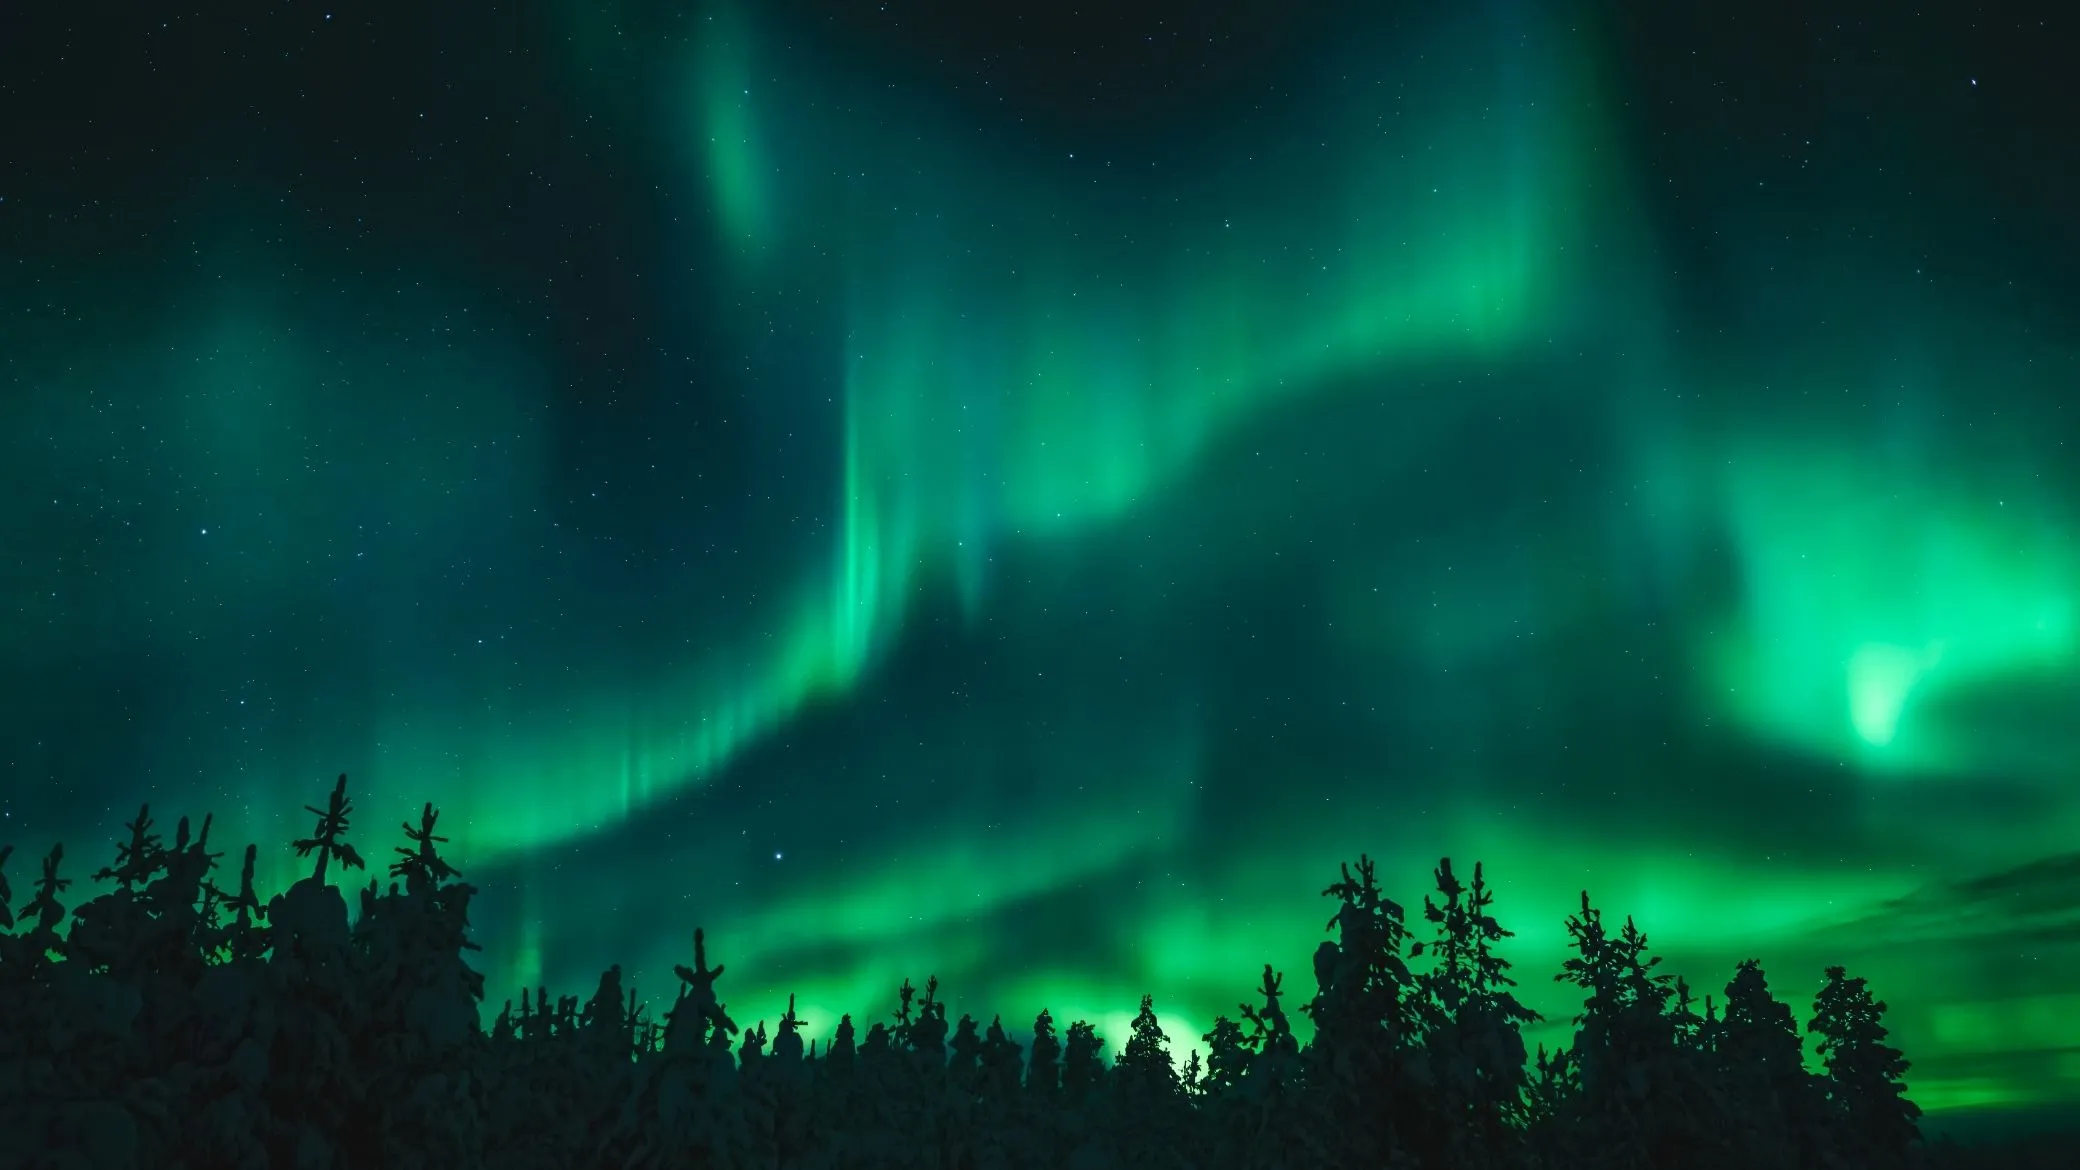
Midwinter under the oval: the aurora is there, even when the statistics are at their lowest.
Usable night starts earlier than you think: 6.5 hours on September 15 in Tromsø
The rule “from the autumn equinox” rests on a simple idea: you need a dark night, and it sets in around September 22. But “dark” does not mean astronomical night, with the Sun 18 degrees below the horizon. A real aurora is visible well before that. Norya uses a −10° threshold in its darkness calculation, and the page on where to see the northern lights gives the opening date of the season place by place.
What changes is the number of hours. On September 15 in Tromsø, the Sun stays below −18° for 0 hours: astronomical night has not started. It still stays below −10° for 6.5 hours, enough to see an aurora. In Fairbanks the usable season opens on August 13 rather than September 5, more than three weeks earlier.

Between seasons: grass, patches of snow, and an aurora already.
Tromsø, Reykjavik and Yellowknife come within an hour and a half of Fairbanks, except in April and August, where the gap reaches up to three hours. The full table is there to compare them.
The full table: five places, twelve months
| Month | Tromsø | Fairbanks | Reykjavik | Yellowknife | Minneapolis |
|---|---|---|---|---|---|
| January | 16.1 h | 15.1 h | 14.9 h | 14.7 h | 12.9 h |
| February | 12.8 h | 12.6 h | 12.5 h | 12.4 h | 11.8 h |
| March | 9.0 h | 9.5 h | 9.6 h | 9.7 h | 10.4 h |
| April | 2.2 h | 5.3 h | 5.5 h | 6.1 h | 8.7 h |
| May | 0 h | 0 h | 0 h | 0 h | 7.1 h |
| June | 0 h | 0 h | 0 h | 0 h | 6.1 h |
| July | 0 h | 0 h | 0 h | 0 h | 6.5 h |
| August | 0 h | 2.0 h | 2.7 h | 3.9 h | 7.9 h |
| September | 6.5 h | 7.7 h | 7.8 h | 8.1 h | 9.7 h |
| October | 11.1 h | 11.2 h | 11.2 h | 11.2 h | 11.2 h |
| November | 14.8 h | 14.1 h | 14.1 h | 13.8 h | 12.6 h |
| December | 17.1 h | 15.7 h | 15.6 h | 15.2 h | 13.2 h |
December has 15.7 hours of usable night in Fairbanks, October 11, September 7.7
The chart puts the trade-off in numbers. September is the most active month, but its nights are the shortest of the season. December has the longest nights and the lowest activity. October keeps a bit of both: the second-highest activity of the year and already 11 hours of night, everywhere in the far north. March and November come close.
In the lower 48, the season has no gap, it has short nights
In Minneapolis the Sun drops below −10° every night of the year: even at the solstice it sits 21.6 degrees below the horizon at midnight. There is no summer hole as there is north of the Arctic Circle. What changes is the length: 13.2 hours of usable night in December, 6.1 in June.
Storms decide the rest. On May 11, 2024, in the middle of a short spring night, the Kp index touched 9, the top of the scale, for the first time since October 2003. From the lower 48 there is no bad season: there are only nights without a storm, and there are slightly more of them in December.
The 2026-2027 calendar: when the Moon leaves you the sky
The Moon is the third variable, and the only one you can read months ahead. A full Moon does not switch off an active aurora, but it washes out the faint ones. Within five days of the new moon, at most 26% of the disk is lit, and the sky stays dark.
| Month | Dark window | Full moon |
|---|---|---|
| October 2026 | Oct 5 to 15 (new moon Oct 10) | Oct 26 |
| November 2026 | Nov 4 to 14 (new moon Nov 9) | Nov 24 |
| December 2026 | Dec 4 to 14 (new moon Dec 9) | Dec 24 |
| January 2027 | Jan 2 to 12 (new moon Jan 7) | Jan 22 |
| February 2027 | Feb 1 to 11 (new moon Feb 6) | Feb 20 |
| March 2027 | Mar 3 to 13 (new moon Mar 8) | Mar 22 |
| April 2027 | Apr 1 to 11 (new moon Apr 6) | Apr 20 |
Dates in UTC, within a day of local dates elsewhere. Calculated in September 2026 for the 2026-27 season and refreshed every August. Phases come from Meeus’s algorithm, checked against five known dates (eclipses of 2024, 2025 and 2026): the largest error is under one minute.
Norya computes the Moon’s phase and its height above your horizon for your position and folds it into its score: a Moon that has set by 11 pm does not penalize the rest of the night.
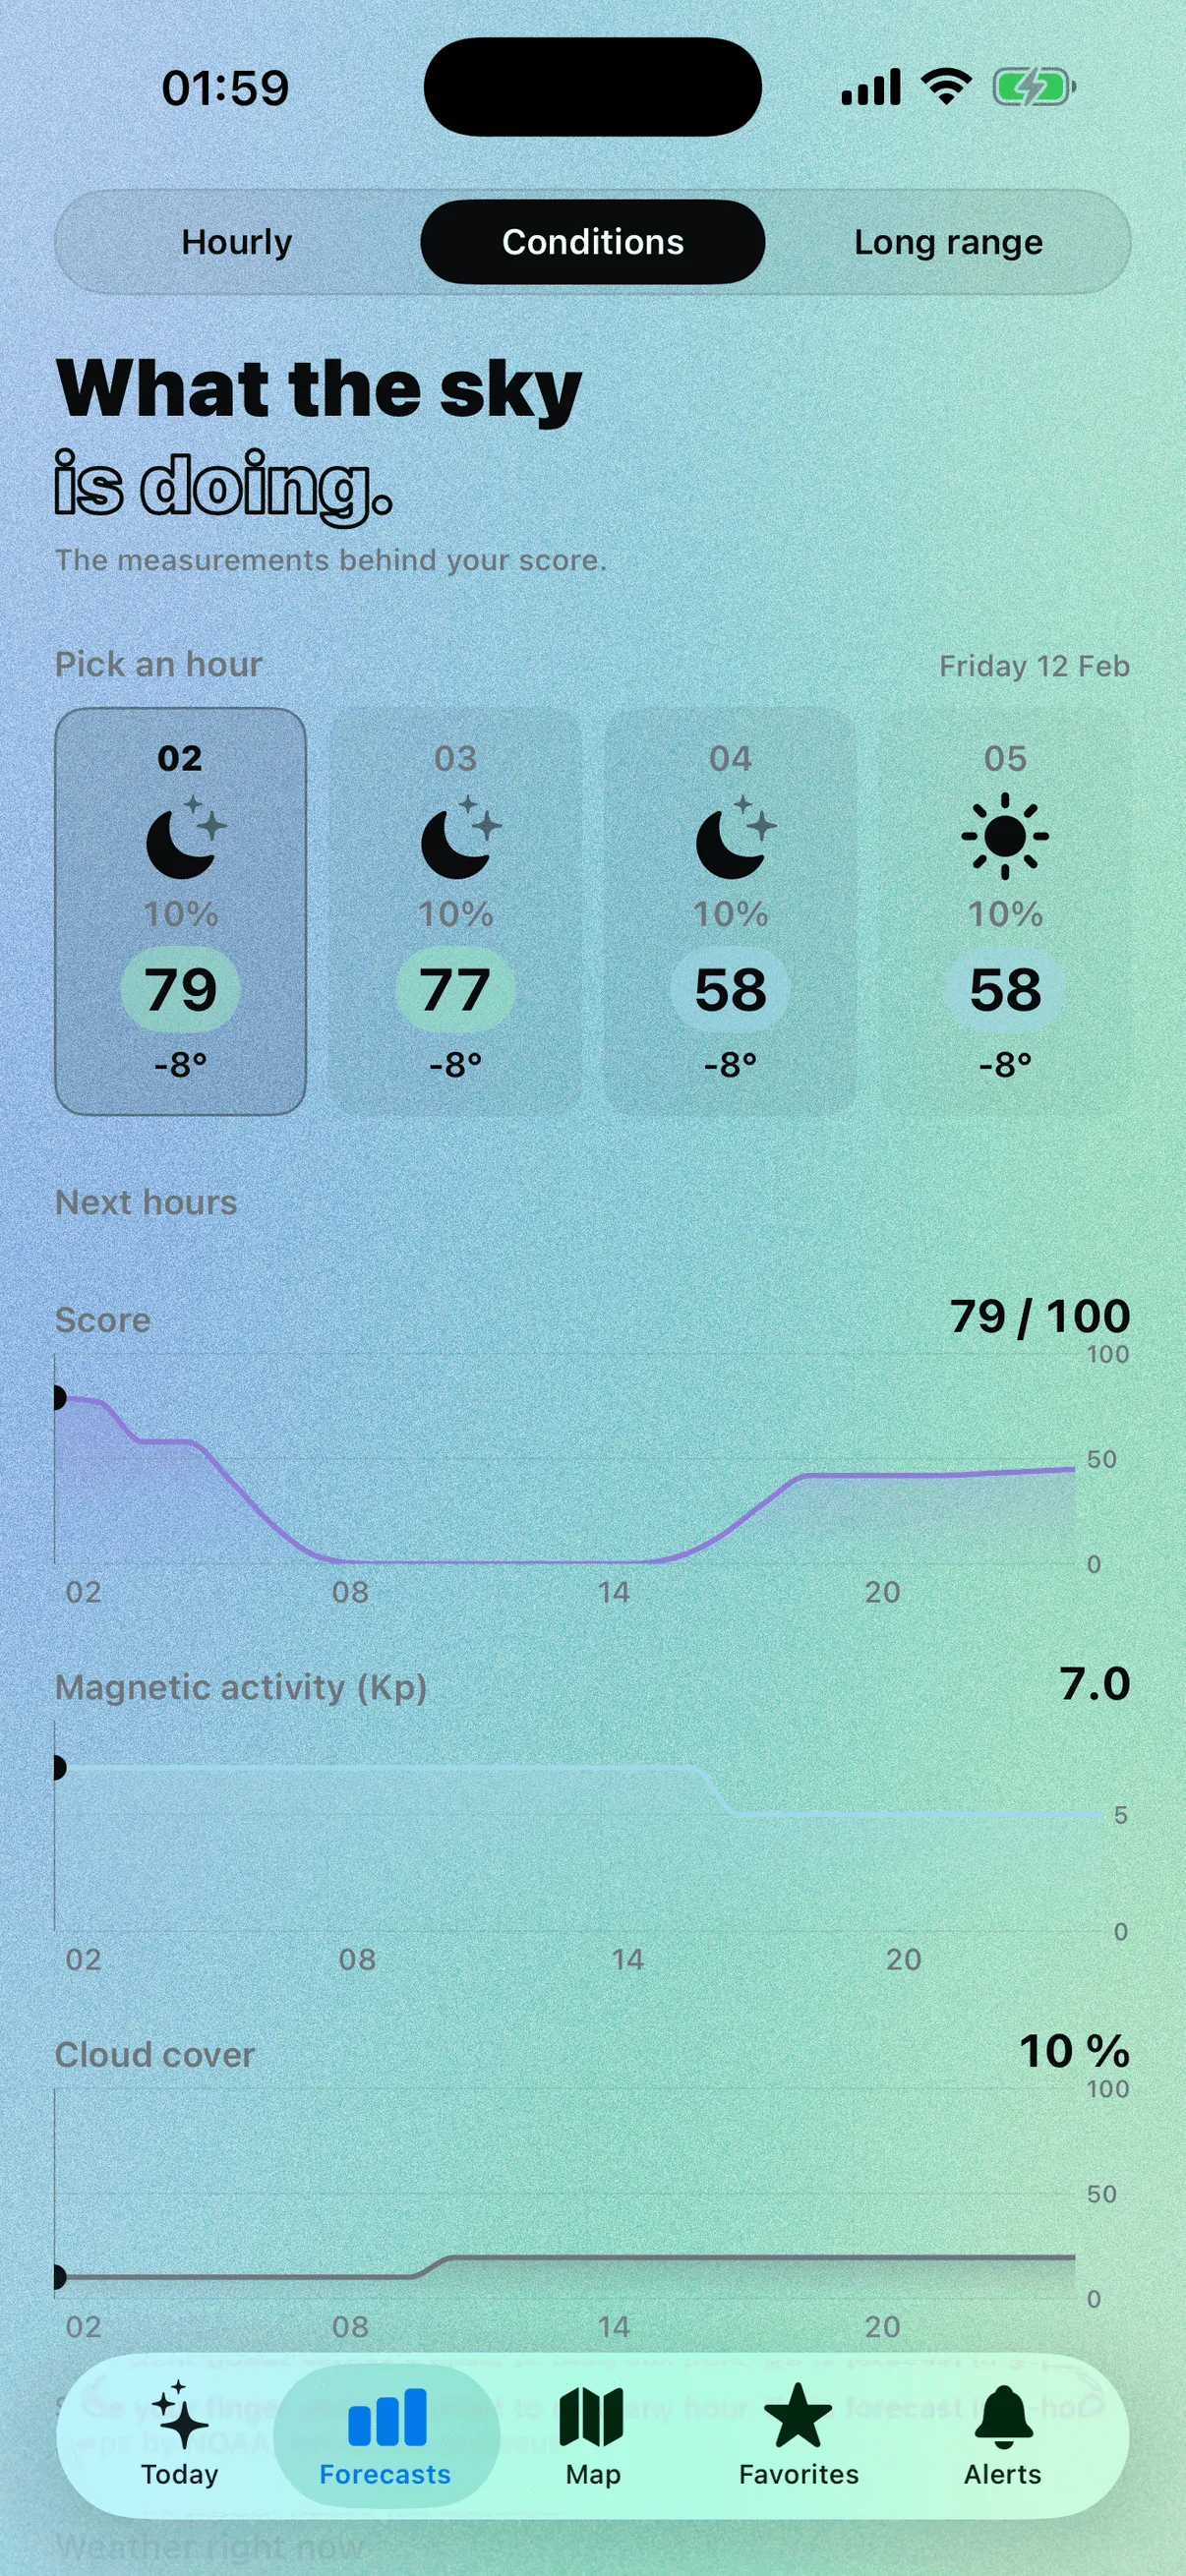
The five factors, Moon included, for your position.
What the Moon really erases
Under the oval, a Kp 2 or 3 aurora is already bright, and a full Moon hardly bothers it. From the lower 48 or Europe the aurora is low and faint: a full Moon is enough to drown it. That is where timing an outing on the new moon really changes the odds.
Is 2026 the best year? Storms peak after the sunspots, and 2026-27 is not over
You read everywhere that solar cycle 25 peaked in 2024 and the window is closing. The sunspot maximum, yes: October 2024. The maximum of geomagnetic storms, no, and the two previous cycles show it.
Cycle 23 had its sunspot maximum in November 2001 and its busiest year in 2003, with 120 storm days. Cycle 24, maximum in April 2014, had its own in 2015. For cycle 25, maximum in October 2024, 2025 counted 62 days, well above 2024 (36). That makes 2025 the third busiest year since 2000, behind 2003 and 2000. 2026 stands at 38 through September 28, a pace of about 50: one of the best years of the last two decades, but not the best.
After their busiest year, cycles 23 and 24 kept two more years above 35 storm days (2004 and 2005, then 2016 and 2017). Then the count fell: 19 days in 2007, 12 in 2019, and 3 at the two minimums of 2009 and 2020. If cycle 25 follows the same pattern, 2026 and 2027 stay rich, and the drop starts around 2028. The next solar minimum is expected between 2030 and 2032, depending on whether the cycle lasts eleven years, like the 24th, or twelve and a half, like the 23rd.
It is a benchmark, not a forecast: two cycles do not make a law, and a single event is enough to make a year a liar.
Coronal mass ejections and coronal holes, two different engines
Two mechanisms feed storms. Coronal mass ejections are puffs of plasma thrown out by the Sun: violent, unpredictable, more frequent around sunspot maximum. Coronal holes are regions where a fast solar wind streams out: less brutal, but they come back about every 27 days, with each rotation of the Sun, and weigh heavily in the declining years.
It is the only usable regularity. It still does not let you forecast an aurora more than a few days out.
This year, so far
Through September 28, 2026, the year counts 38 storm days out of 271, 6 of them at Kp 7- or higher. That is well above what New York (Kp 5.0) or Chicago (Kp 4.6) need for a glow on the northern horizon.
A night of aurora has a shape: arcs in the evening, swirls near midnight, diffuse patches by morning
According to NOAA, the rays of the aurora form arcs in the evening that stretch from horizon to horizon. Near midnight, the arcs start to twist and sway, then can fill the whole sky and turn very bright: that is the peak of what is called an auroral substorm. By early morning the aurora turns diffuse, in patches that blink on and off for hours before vanishing with the sunrise.
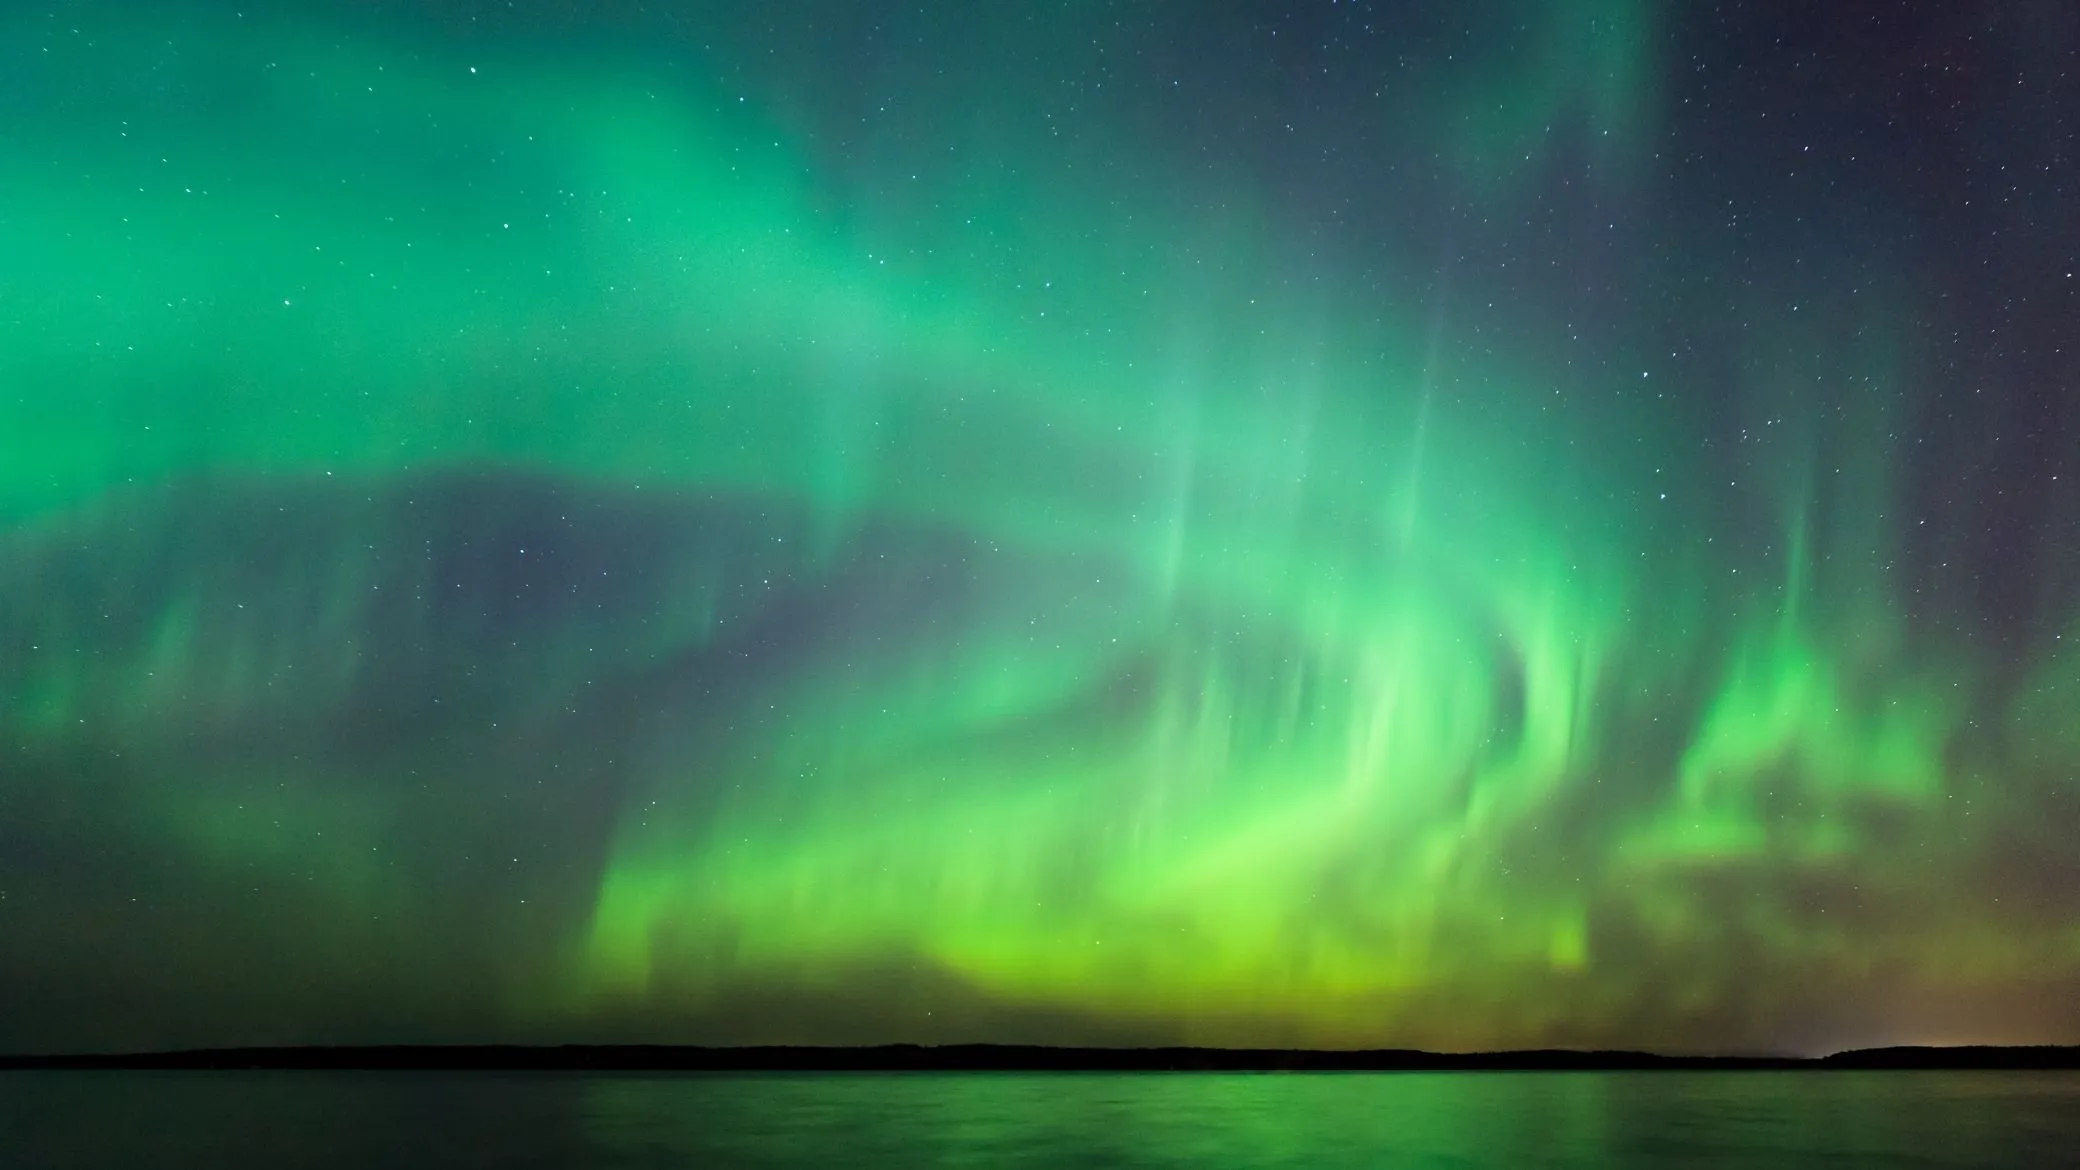
Curtains that twist and fill the sky: what NOAA describes near midnight.
That is why NOAA gives the window as 10 pm to 2 am local time, around midnight, when the most spectacular part is concentrated. A night of aurora has a high point, but it is not just that.
What remains is the question of whether tonight is the night. It means weighing activity, clouds, darkness and the Moon for your position, and that is the calculation Norya does for you instead of leaving you to read an index.
Frequently asked questions
Why is 2026 the best year to see the northern lights?
September or March: which month should I book?
Should I plan my trip around the new moon?
Should I go in 2027 or wait until 2029?
Are December and January a bad time to go?
Will the northern lights be visible on November 12?
Articles in this guide

Best time to see the northern lights in Iceland: month by month
Reykjavik's season runs August 10 to May 4, not September to April. Usable night, storm days and clear skies for each month, measured, plus the Moon.