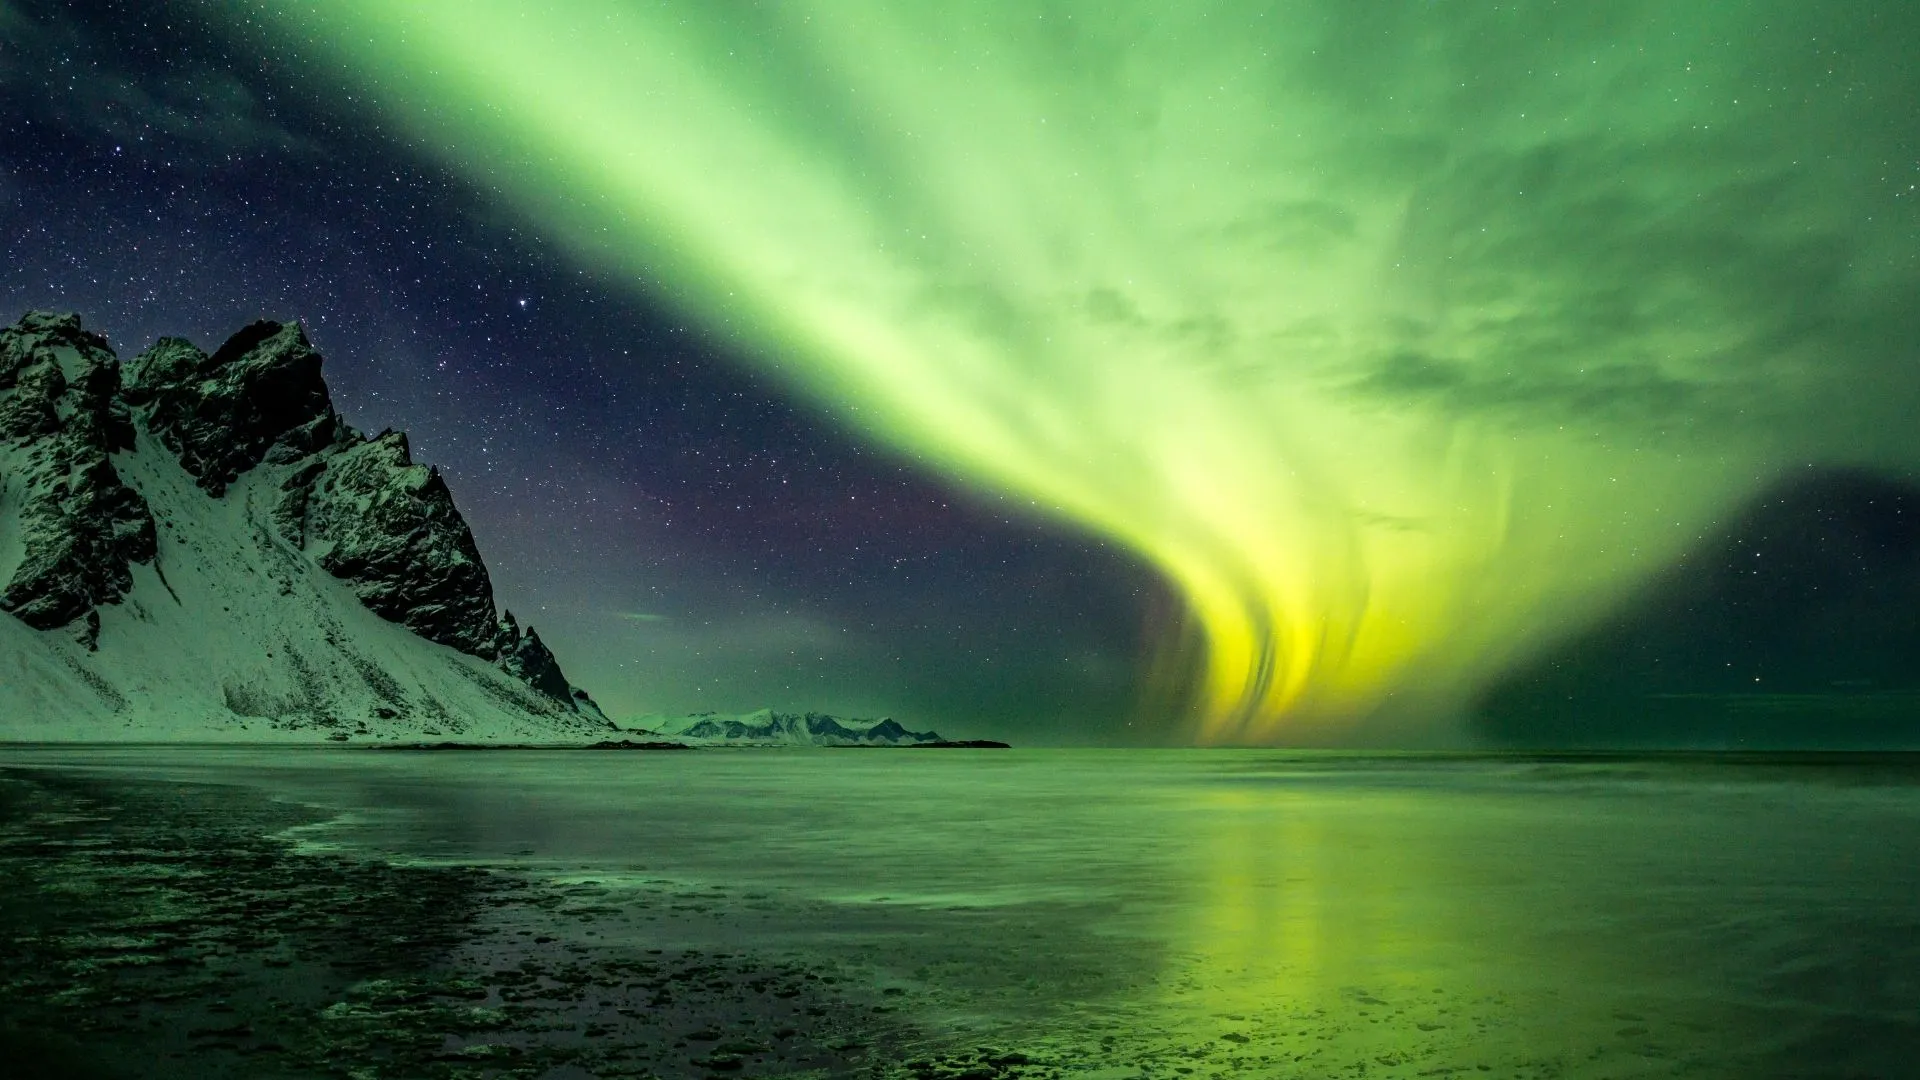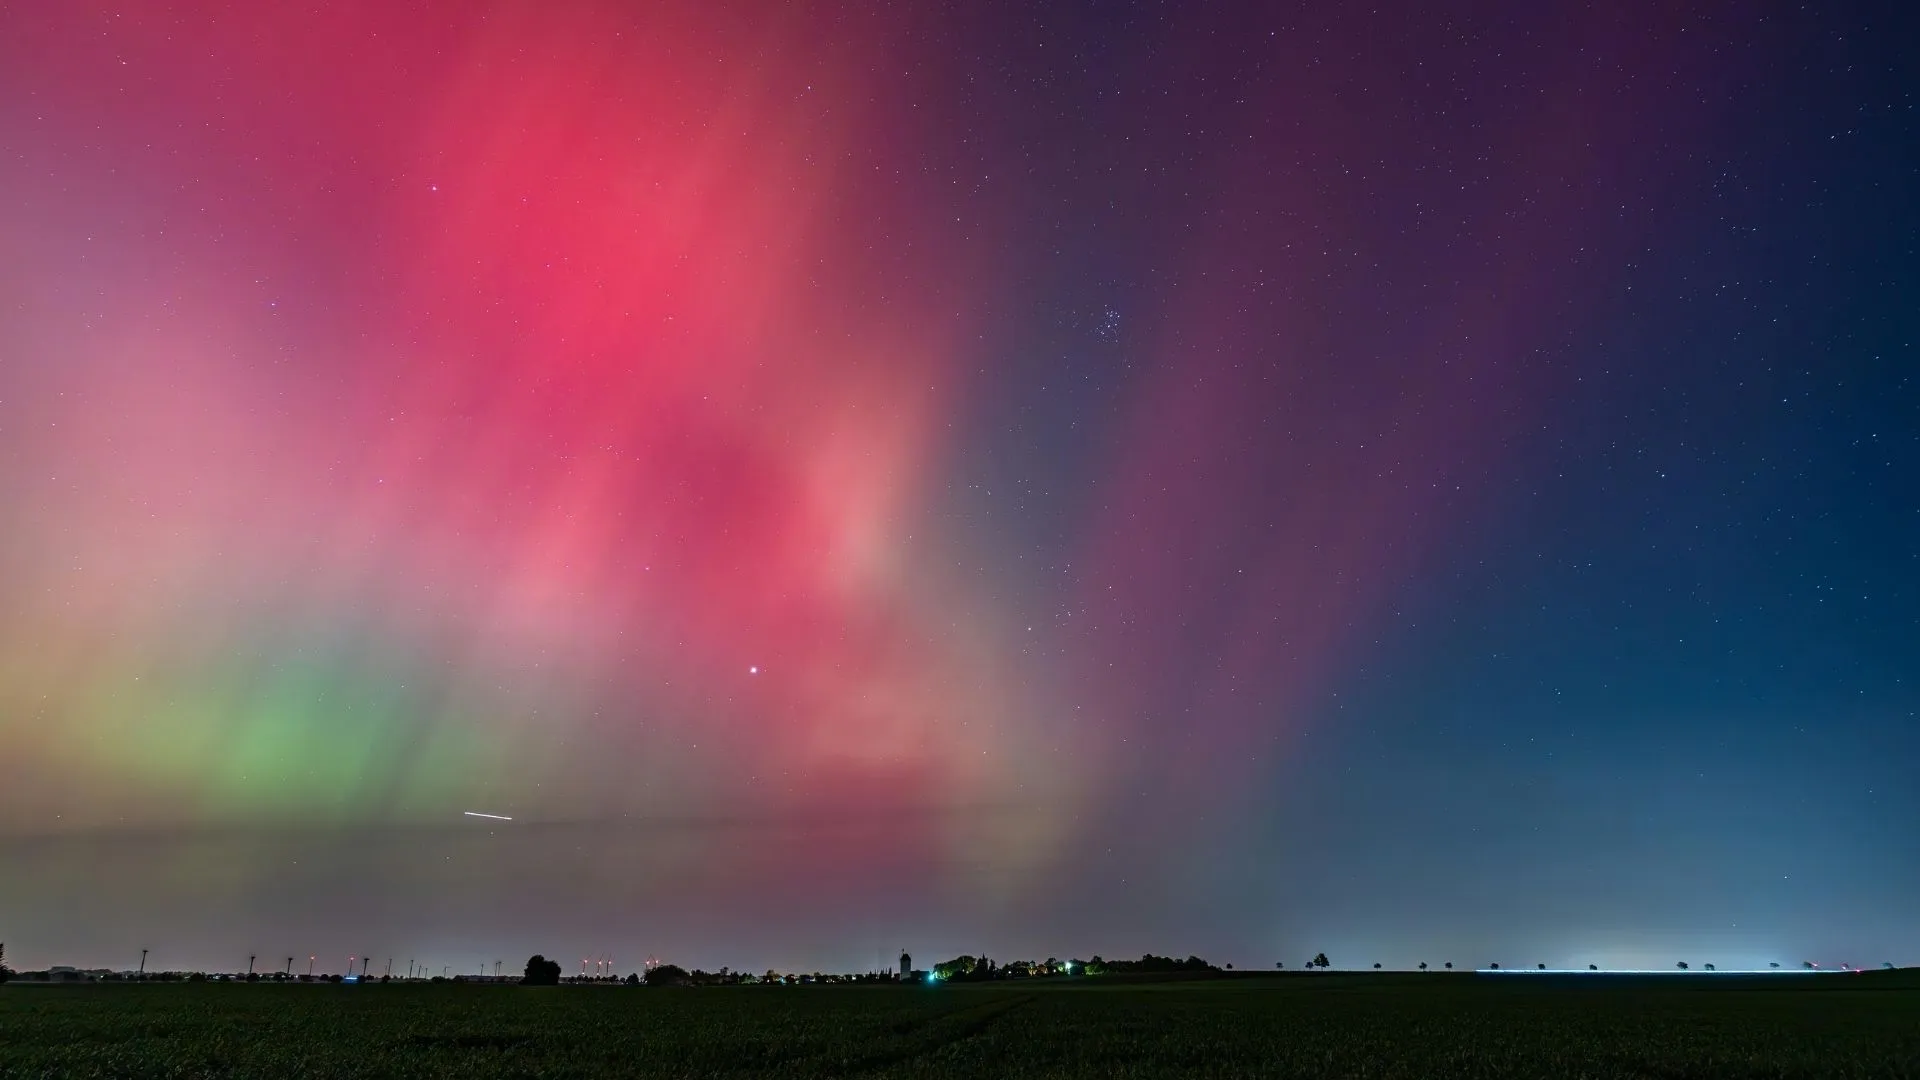
The Kp index rates, from 0 to 9, how hard Earth’s magnetic field is being shaken, in three-hour slices. Kp 5 is the threshold of a geomagnetic storm (level G1 on NOAA’s scale): comfortably enough for a glow from Copenhagen, only just from Paris, and short of New York, where NOAA’s own figures call for Kp 6. And even when the number is reached, the sky is overcast on between one alert night in three and one in two.
This article explains the number: what it measures, what each level lets you see depending on where you stand, how often it happens, and why it cannot decide on its own whether you should go outside. The thresholds for twenty-three cities come from a rule NOAA publishes, cross-checked against what NOAA has observed, including where our own rule falls short. They are orders of magnitude, not guarantees.
Kp is measured below the oval, between 44° and 60° latitude: why Kp 0 doesn’t rule out the aurora in Iceland
Kp is not a measurement of the aurora. According to NOAA, it is the average of the disturbances recorded by thirteen observatories located between 44° and 60° geomagnetic latitude. Each one records, over three hours, the largest horizontal fluctuation of the field, which is turned into a local index (the K index) and then into a 0 to 9 scale. The idea goes back to Julius Bartels in 1938, who called it the “Kennziffer”, the key figure.
Those observatories sit below the auroral oval, not inside it. Kp therefore tells you how strong the disturbance is at middle latitudes, not whether the aurora is above you. In Reykjavik, Tromsø or Rovaniemi you are already under the oval: the aurora passes overhead even when the index reads 0. In Paris you are far from it: the oval has to move down by several degrees, so the storm has to be strong, before a glow reaches the horizon.
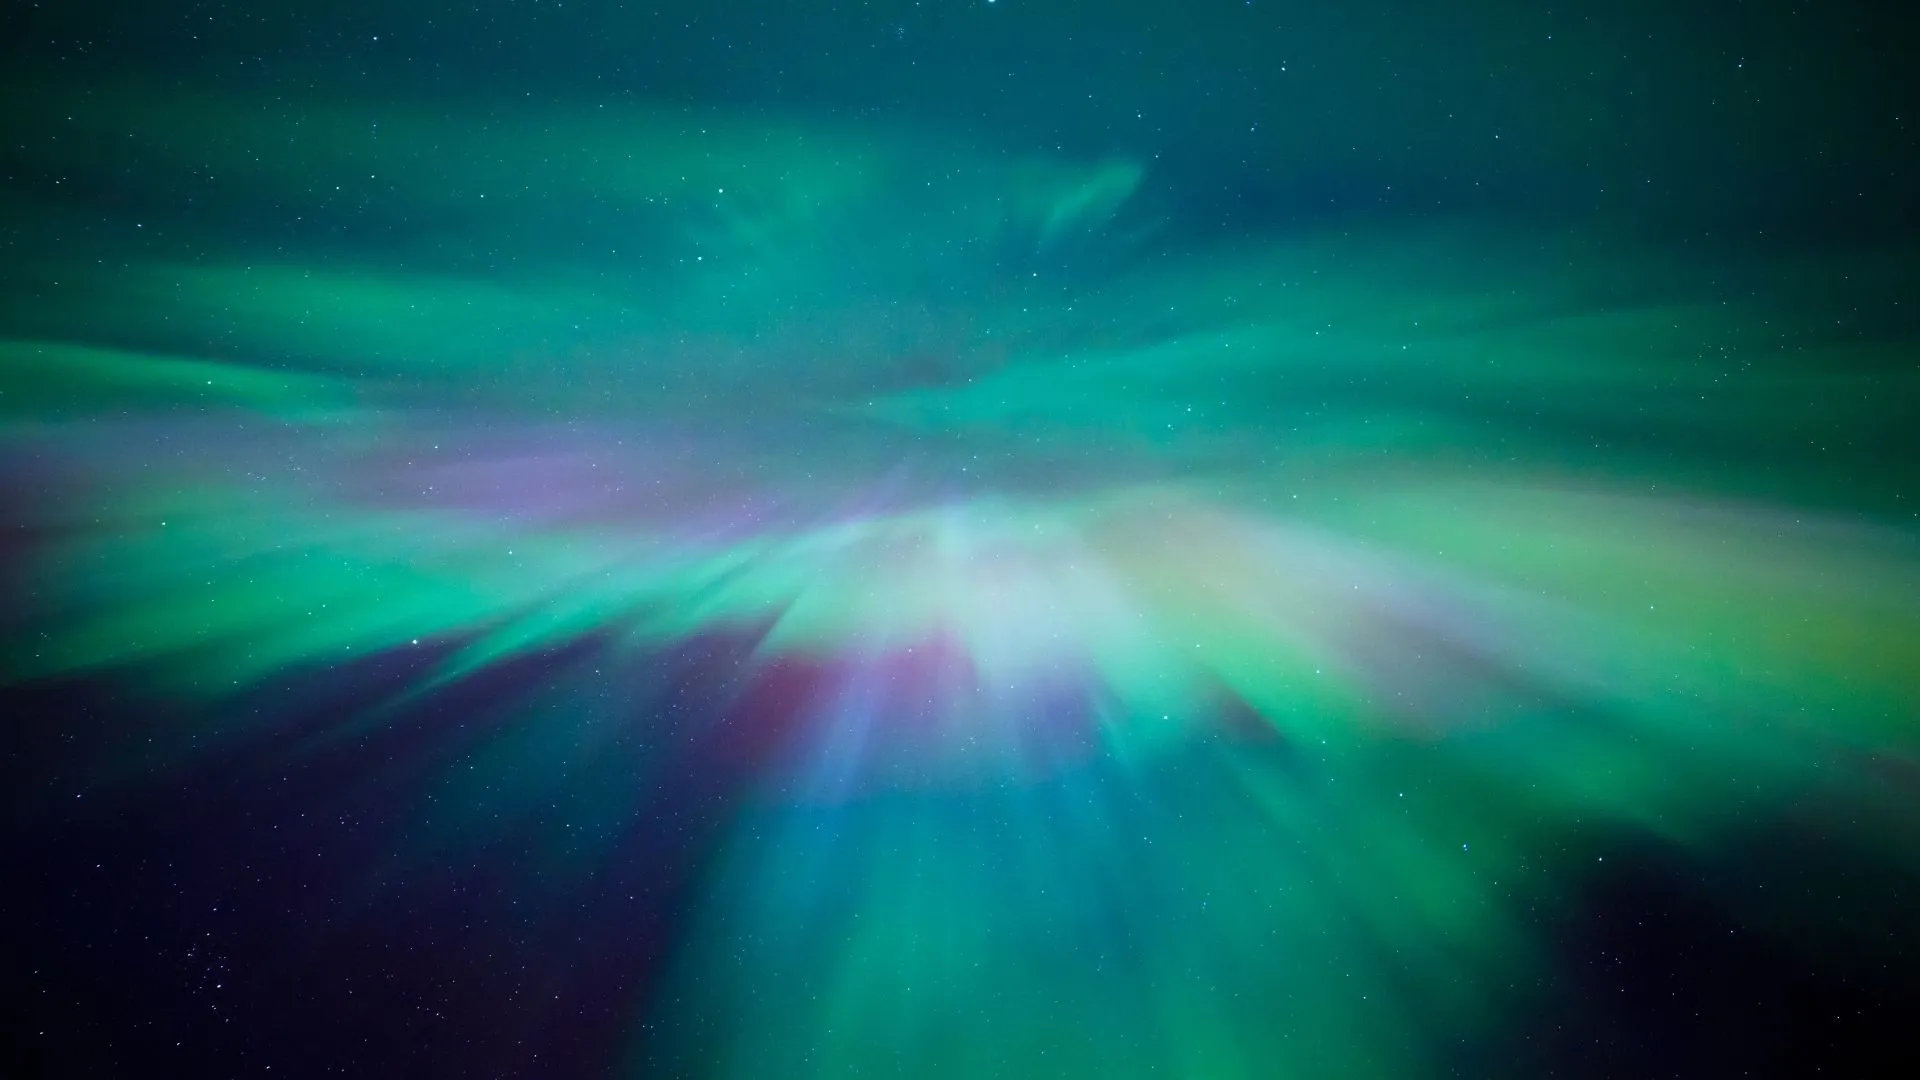
A corona: the rays seem to radiate from the zenith, which is what you see when the oval passes right overhead.
Estimated, forecast, final: three different Kp values
The Kp you read live is an estimate. NOAA’s Space Weather Prediction Center (SWPC) recalculates it every minute from just eight magnetometers, and issues alerts when it reaches 4, 5, 6, 7, 8 and 9. The forecast Kp is a prediction, published three days ahead. The final Kp is computed later from all thirteen observatories by GFZ Potsdam, which has kept the series since 1932.
The three can differ by a step. An alert at an estimated Kp 6 can end up as 5+ in the final record, and the other way round. The statistics in this article use GFZ’s final Kp.
Why three hours, and why 5− and 5+
The scale runs from 0 to 9 in thirds: 4+, 5−, 5o, 5+, 6−. A “Kp of 5” is therefore not a round number: it is 5−, 5o or 5+. On every page of this site, “Kp 5 or higher” means that at least one three-hour interval reached 5o or more, 5− excluded. This convention counts fewer days than one that includes 5− (36 days a year against about 49), and it explains differences with other sites.
What Kp 5 means: a storm, and a threshold that changes from place to place
NOAA ranks geomagnetic storms from G1 to G5, and attaches to each level the latitudes where the aurora has been seen. The table sets them beside how often each level occurs, from 1996 to 2025.
| Level | Kp | Where NOAA places the aurora | Days per year |
|---|---|---|---|
| G1, minor | 5 | Visible at high latitudes (northern Michigan and Maine) | 35.7 |
| G2, moderate | 6 | As far south as New York and Idaho (typically 55° geomagnetic latitude) | 12.2 |
| G3, strong | 7 | As far south as Illinois and Oregon (typically 50°) | 4.6 |
| G4, severe | 8, including 9− | As far south as Alabama and northern California (typically 45°) | 1.5 |
| G5, extreme | 9 | As far south as Florida and southern Texas (typically 40°) | 0.1 |
Days per year on which at least one three-hour interval reaches the level, 5o and above. G1 therefore counts every day at Kp 5 or higher, G2 those at Kp 6 or higher, and so on.
The table values are thirty-year averages, and activity is uneven: 2024 had 36 days at Kp 5 or higher, 22 at Kp 6 and 13 at Kp 7; 2025 had 62, 21 and 8. Through October 12, 2026 stands at 41, 15 and 7. The only Kp 9 since 1996 came on four days: July 15, 2000, October 29 and 30, 2003, and May 11, 2024.
Kp 5 is not rare
One day in ten reaches Kp 5 or higher (9.8% of days). One day in 79 reaches Kp 7 or higher. Counted by three-hour interval, 27.6% reach Kp 3, 4.0% reach Kp 5 and 0.4% reach Kp 7. Kp 5 is not the exceptional storm some headlines announce: it is the level at which someone in Copenhagen or London can hope for something, and someone in Lyon will see nothing.
Kp 5 is plenty in Copenhagen, barely in Paris: thresholds for twenty-three cities
The rule NOAA publishes is simple: the lower edge of the oval moves down by about two degrees per step of Kp, starting from 66° geomagnetic latitude at Kp 0. To see a glow on the northern horizon, that edge has to be within about six degrees of you. A city’s threshold is therefore (66 − geomagnetic latitude − 6) ÷ 2. For the aurora overhead, the edge has to pass over you without that margin: (66 − geomagnetic latitude) ÷ 2.
In Reykjavik and Fairbanks the threshold is 0: you are under the oval. In Copenhagen it is 2.3, so Kp 3 will do. In Paris it is 4.8, just Kp 5. In Rome it is 9.0: the strongest storm in thirty years, and even then only just.
The full table: twenty-three cities
| City | Latitude | Geomagnetic latitude | Kp for a glow | Kp for overhead |
|---|---|---|---|---|
| Reykjavik | 64.2° | 68.9° | 0 | 0 |
| Tromsø | 69.7° | 67.5° | 0 | 0 |
| Fairbanks | 64.8° | 65.6° | 0 | 0.2 |
| Rovaniemi | 66.5° | 63.6° | 0 | 1.2 |
| Inverness | 57.5° | 59.8° | 0.1 | 3.1 |
| Stockholm | 59.3° | 58.0° | 1.0 | 4.0 |
| Copenhagen | 55.7° | 55.3° | 2.3 | 5.3 |
| Vancouver | 49.3° | 54.6° | 2.7 | 5.7 |
| London | 51.5° | 53.4° | 3.3 | 6.3 |
| Minneapolis | 45.0° | 53.6° | 3.2 | 6.2 |
| Seattle | 47.6° | 53.1° | 3.5 | 6.5 |
| Berlin | 52.5° | 52.2° | 3.9 | 6.9 |
| Brussels | 50.9° | 52.0° | 4.0 | 7.0 |
| Lille | 50.6° | 52.0° | 4.0 | 7.0 |
| Chicago | 41.9° | 50.8° | 4.6 | 7.6 |
| Paris | 48.9° | 50.4° | 4.8 | 7.8 |
| New York | 40.7° | 50.0° | 5.0 | 8.0 |
| Strasbourg | 48.6° | 49.3° | 5.4 | 8.4 |
| Munich | 48.1° | 48.2° | 5.9 | 8.9 |
| Lyon | 45.8° | 47.0° | 6.5 | out of reach |
| Marseille | 43.3° | 44.5° | 7.7 | out of reach |
| Madrid | 40.4° | 43.2° | 8.4 | out of reach |
| Rome | 41.9° | 42.0° | 9.0 | out of reach |
Two-degrees-per-step rule from 66°, plus a six-degree margin for a glow on the horizon. “Out of reach”: above Kp 9. These are orders of magnitude: a bright aurora is seen lower, a faint one not at all.
What NOAA has observed, and where our rule goes wrong
A rule is only worth as much as its test against what NOAA has actually observed. NOAA ties each storm level to a “typical” latitude where the aurora has been seen. Here is the gap with the oval edge the two-degrees rule gives:
| Kp | Oval edge, rule (66° − 2 × Kp) | Typical latitude, NOAA | Gap |
|---|---|---|---|
| 6 | 54° | 55° | 1° |
| 7 | 52° | 50° | 2° |
| 8 | 50° | 45° | 5° |
| 9 | 48° | 40° | 8° |
Up to Kp 7 the rule lands within one or two degrees of what NOAA cites. In the strongest storms it underestimates how far the oval expands: at Kp 9 NOAA places the aurora at 40°, the rule at 48°. In other words, the thresholds for southern cities are on the pessimistic side during the very biggest storms.
The other gap goes the opposite way, and it matters for most readers. NOAA ties New York to Kp 6 and Chicago to Kp 7; our rule gives them Kp 5.0 and 4.6. Cross-checking, our thresholds run about one step too optimistic at the latitudes of Paris and New York, and hold up toward the Mediterranean. We worked this through for five French cities, since that is where the question came up first:
| City | Threshold by the rule | Estimate cross-checked with NOAA |
|---|---|---|
| Lille | 4.0 | around 5.5 |
| Paris | 4.8 | around 6 |
| Strasbourg | 5.4 | around 6 |
| Lyon | 6.5 | around 6.5 to 7 |
| Marseille | 7.7 | around 7 |
Assumption behind the cross-check: from the pair “55° typical, New York at 50°” that NOAA gives for G2, a glow is seen about five degrees below the typical latitude of the level. It is an estimate, not a measurement: we have no dated observations from France to choose between the two columns.
So plan on one step of margin: from Paris, Kp 5 gives you a chance, Kp 6 a real one. A threshold set too low is paid for in evenings spent outside for nothing, which is why we show both estimates instead of quietly picking one.
Cities that will never see the aurora overhead
In Madrid, Rome, Marseille or Lyon, the aurora overhead would take more than Kp 9. A very low glow on the northern horizon remains possible in the strongest storms only, and it is not the green curtain of the photographs: it is a red haze, clearer on a long-exposure photo than to the naked eye.
Why Kp is not enough: up to one alert night in two is cloudy
Suppose the threshold is reached: Kp is at 5 and your city is far enough north. The sky remains. From 2010 to 2025 we collected the weather observations of the airports at Lille, Paris-Charles-de-Gaulle and Strasbourg, three mid-latitude cities in western Europe, and counted the share of nights offering at least two consecutive hours of sky no more than half covered between 10 pm and 2 am, Paris time.
On nights when Kp reaches 5 or higher, the sky is clear in 53% of cases at Lille, 64% at Paris and 54% at Strasbourg. In other words, a Kp 5 alert sends you outside for nothing on 47% of nights at Lille, 36% at Paris and 46% at Strasbourg. At Kp 6 or higher the clear share drops: 44, 54 and 47%, on about thirty-four nights each.
The season plays a part, in the right direction for once: the months with the most storms are also among the clearest in western Europe. September (14.0% of storm days), March (11.9%) and April (11.8%) combine activity and clear skies, as the guide on the best time to see the northern lights explains. December combines the two handicaps: the lowest activity of the year (4.7%) and one of the cloudiest skies (33% clear nights at Paris).
The trough is plain: from November to January, at least one night in two is cloudy at Paris (43, 33 and 34% clear nights), and it is harsher still at Strasbourg, at 28, 31 and 27%. In spring and fall the sky opens: 73% in September, 79% in April.
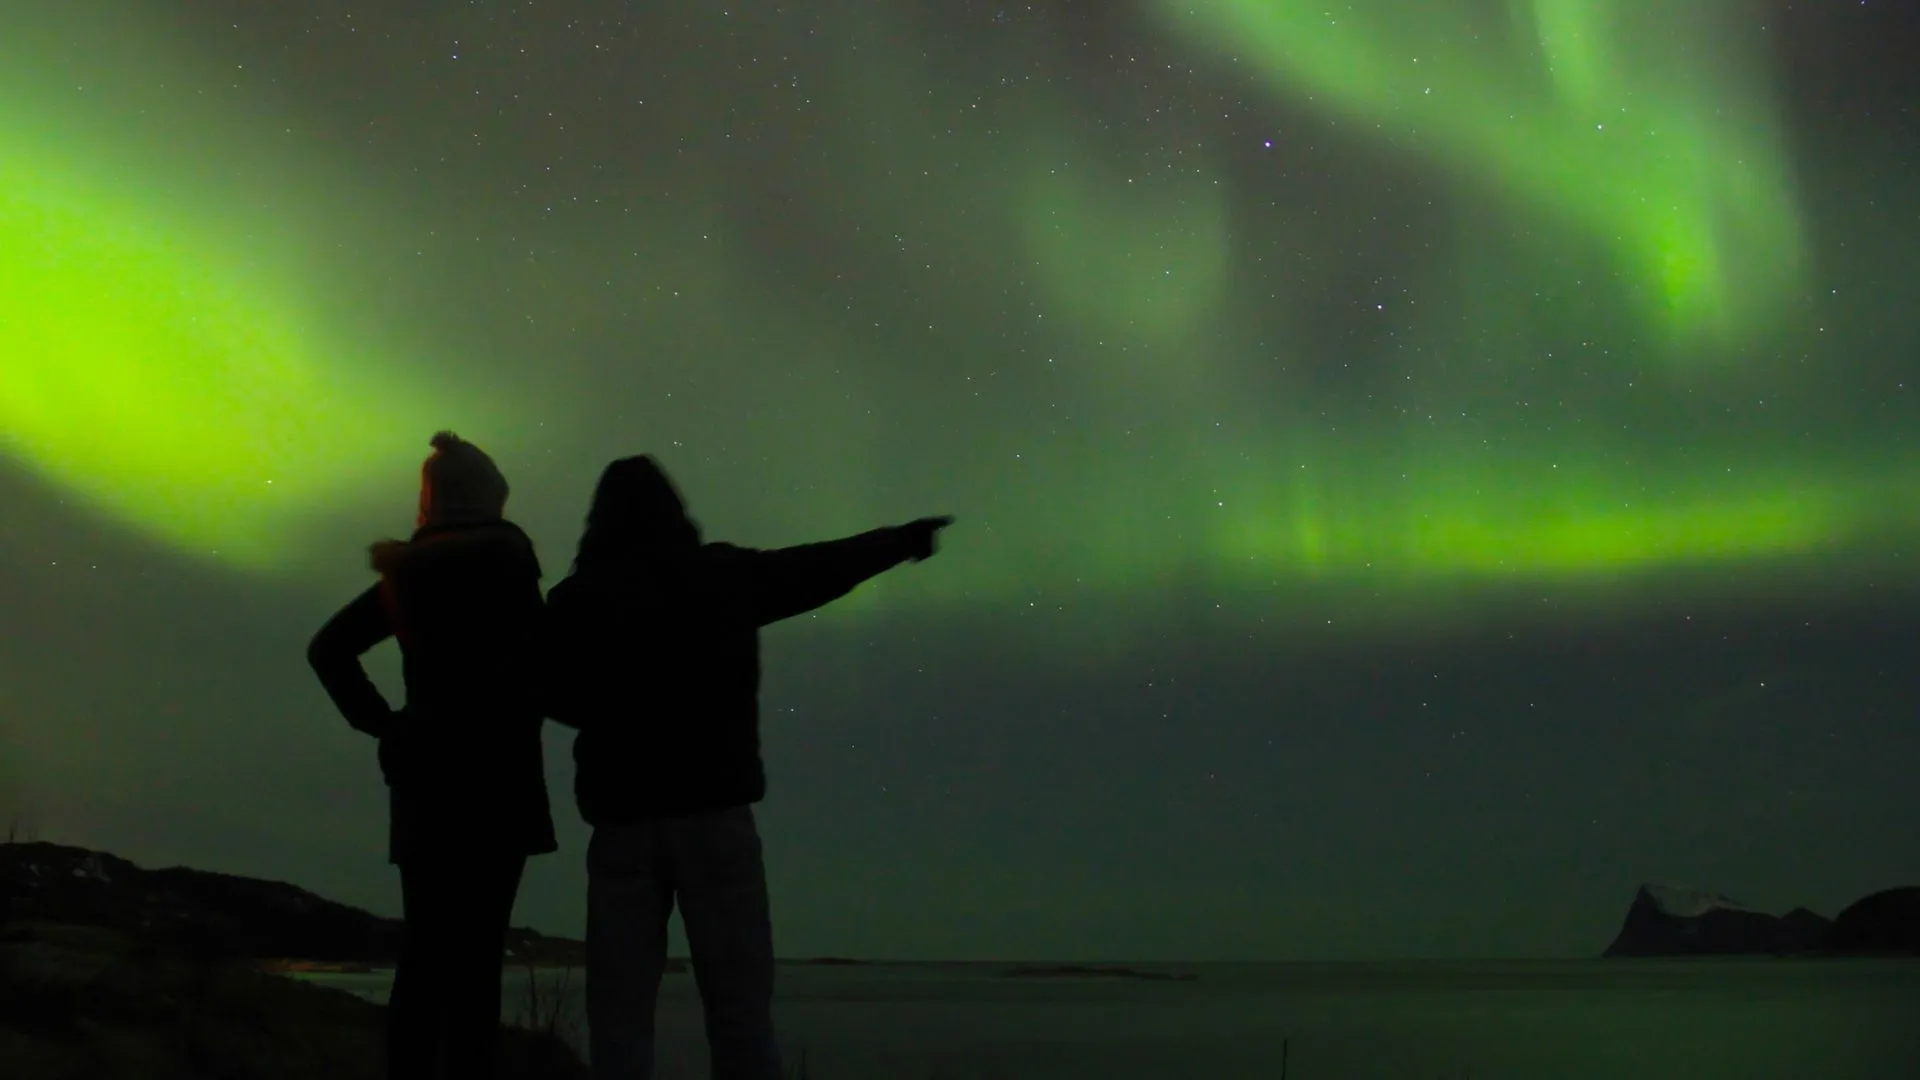
Watching and waiting: Kp says something is happening, not that you will see it.
Three factors Kp ignores: clouds, the Moon, darkness
Clouds, first, which no magnetic index can see. That is the reason for the figure above: a perfect Kp under a layer of stratus is worth nothing.
The Moon next. A full Moon does not extinguish a very active aurora, but it washes out the faint ones, and those seen from mid-latitudes are often of that kind. Its height above the horizon matters as much as its phase: a Moon that has set by 11 pm does not trouble the rest of the night.
Darkness, finally: the Sun has to be well below the horizon. The farther north you go, the more the season tightens around winter, as the guide on where to see the northern lights details.
That is what Norya is for: the app combines Kp, the clouds over you, the Moon and the real darkness into one score out of 100 for your position, and refuses to show one when a piece of data is missing, rather than guessing it.
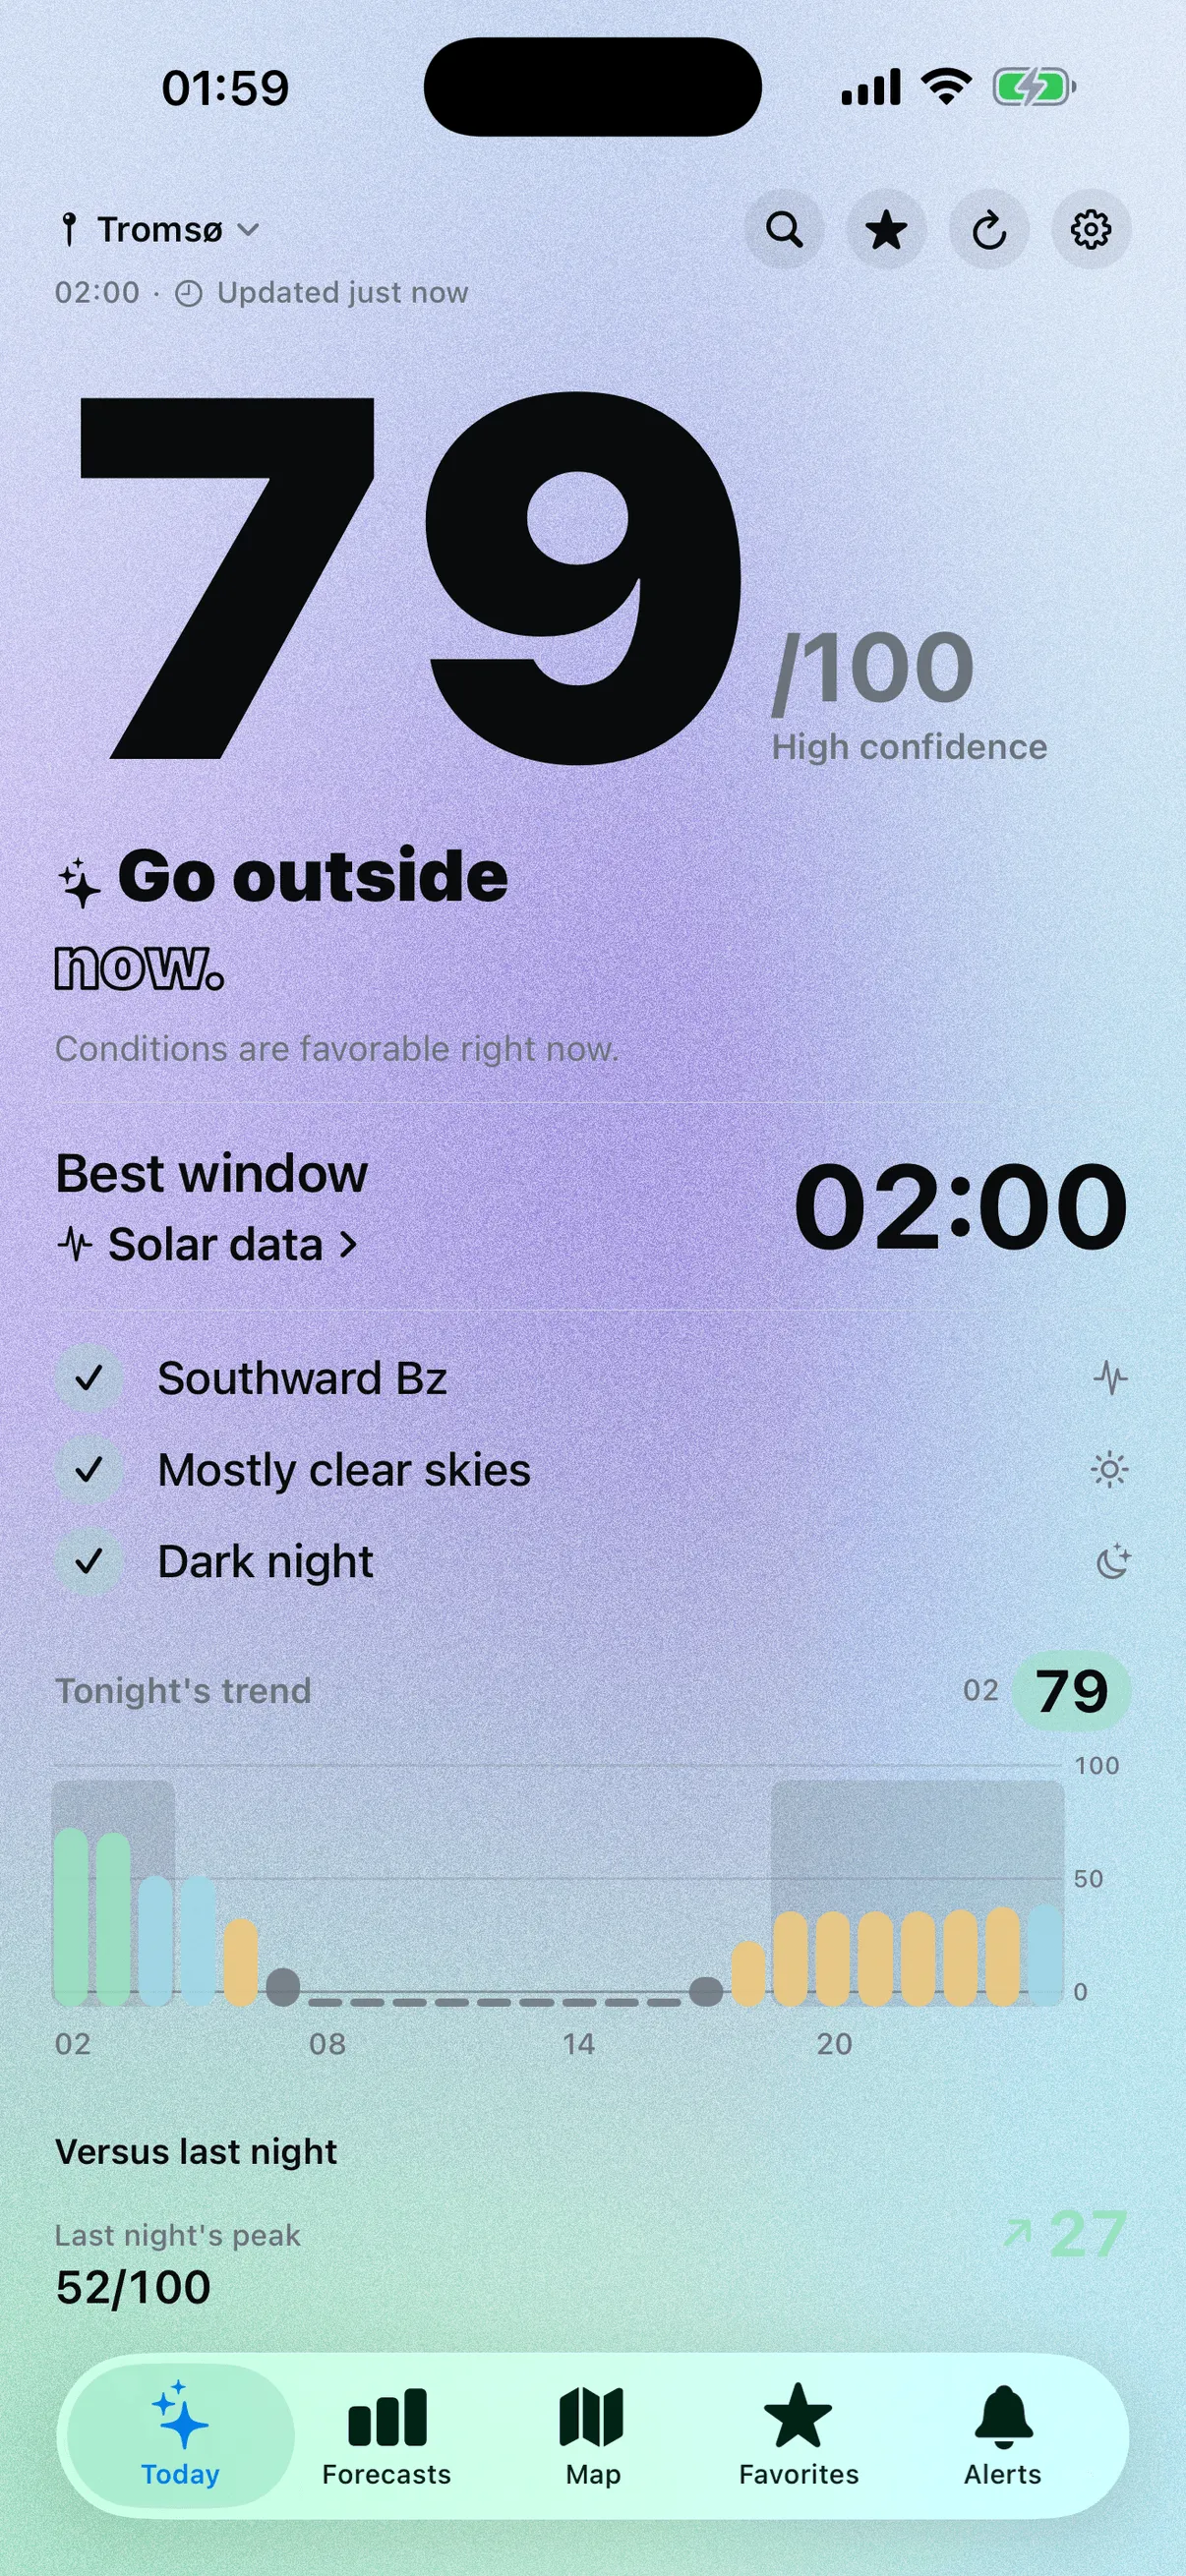
One number for your position, accounting for the sky and the Moon, not Kp alone.
What this measure doesn’t tell you
It rests on one observation point per city, at the airport, and covers only low and middle clouds: a clear sky at Roissy is not necessarily clear where you stand. Nights at Kp 7 or higher number only eight in sixteen years: too few for a statistic, so we stop at Kp 6. And it says nothing about the strength of the aurora.
Method and source: METAR reports from the airports of Lille-Lesquin (LFQQ), Paris-Charles-de-Gaulle (LFPG) and Strasbourg-Entzheim (LFST), 2010 to 2025, via the Iowa Environmental Mesonet. CAVOK, NSC, SKC and CLR skies count as clear, FEW and SCT as no more than half covered. Only nights whose 10 pm to 2 am window is entirely in usable darkness (Sun more than 10° below the horizon) are kept. A night’s Kp is the maximum of the 21:00 to 24:00 and 00:00 to 03:00 UT intervals. Kp: GFZ Potsdam, CC BY 4.0, Matzka et al. 2021 (doi:10.1029/2020SW002641).
Where to read Kp, and which version to believe
Three sources, for three uses.
| Source | What it gives | Use it for |
|---|---|---|
| NOAA SWPC | Estimated Kp every minute, three-day forecast, alerts at steps 4 to 9 | Knowing where things stand tonight |
| GFZ Potsdam | Final Kp, series since 1932 | Checking afterward, building statistics |
| Sites and apps | Republish NOAA’s values, sometimes with a delay | A quick glance, not a primary source |
NOAA holds the live reference value. To decide whether to believe a number, look at its name: “estimated” can move, “forecast” is a prediction. What the number cannot do is speak for your position: that is Norya’s job, converting these values into one figure for where you are, with the clouds and the Moon.